
Install Splunk – It’s free! https://www.splunk.com/en_us/download/splunk-enterprise.html
Modify Program Files\Splunk\etc\system\local\inputs.conf
Add the lines
[WinEventLog]
evt_resolve_ad_obj = 1
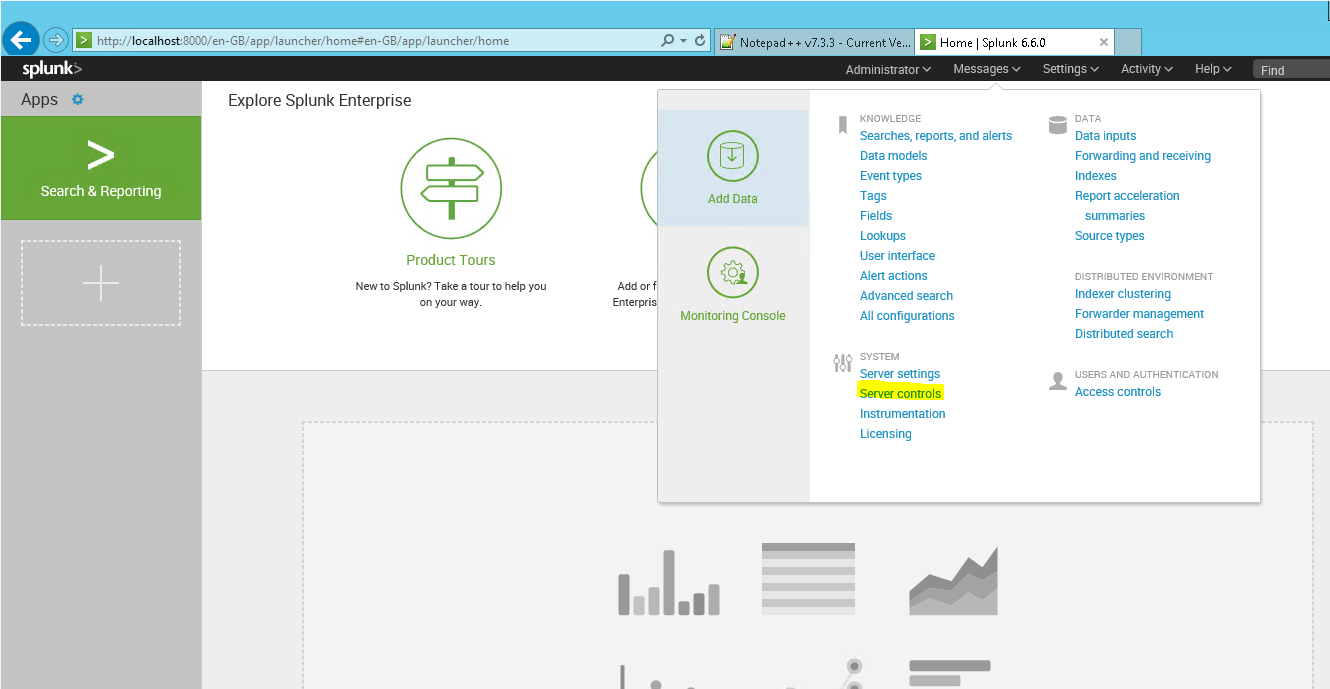
Then we need to reboot splunk, in Splunk click Settings, then Server controls and click Restart Splunk
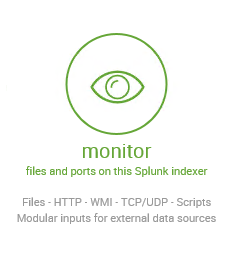
Next we need to add our data source, click Add Data from the launch screen, then monitor

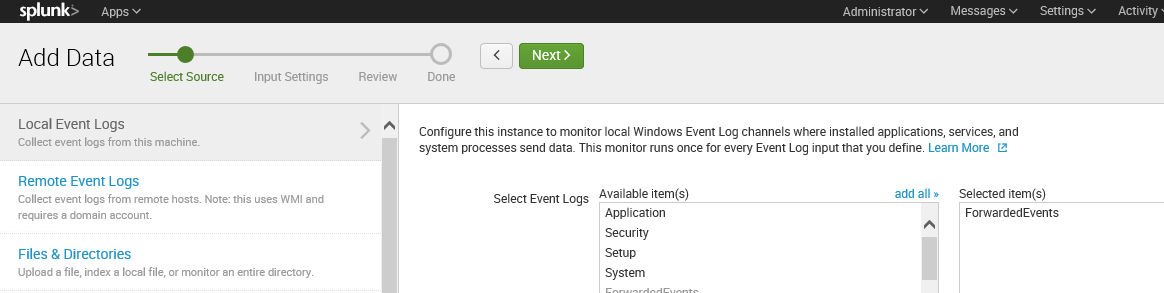
Choose Local Events then ForwardedEvents and click Next
Click Create a new index, call it ForwardedEvents, click Save, change the Index to ForwardedEvents and then click Review, Submit
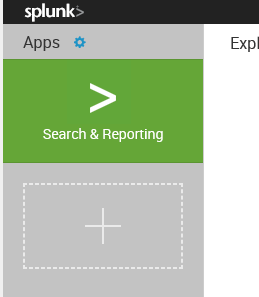
Give it some time to collect a few logins, then go to Search & Reporting
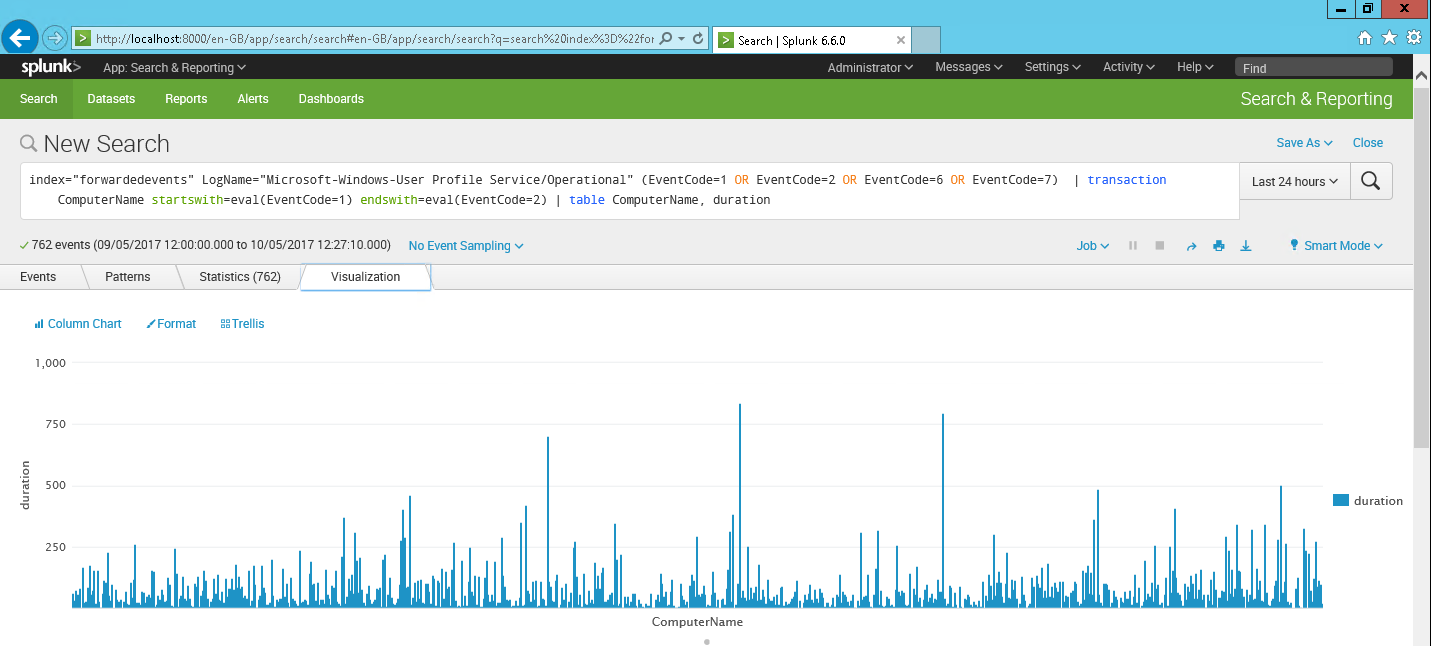
index=”forwardedevents” LogName=”Microsoft-Windows-User Profile Service/Operational” (EventCode=1 OR EventCode=2 OR EventCode=6 OR EventCode=7) | transaction ComputerName startswith=eval(EventCode=1) endswith=eval(EventCode=2) | table ComputerName, duration
So I’m using the selected data, filtering for 4 event codes, then getting the time between event code 1 and 2, and putting it into a table..
Edit: This search can be a bit funny, the delay ended up being between synching the roaming profile so I’ve also ran
index=”forwardedevents” LogName=”Microsoft-Windows-User Profile Service/Operational” (EventCode=1 OR EventCode=2 OR EventCode=6 OR EventCode=7) | transaction ComputerName startswith=eval(EventCode=6) endswith=eval(EventCode=7) | table ComputerName, duration
Then click on the Visualization tab
This also lets you dive into each login by clicking one and get the event logs!
You can save this as a report, dashboard and share with people.
There is so much more you can do with this software, and it takes some time to learn it. Will post more as I do..
Leave a Reply